That the growth of fishes displays seasonal oscillations was well known to the pioneers of fishery biology, notably to T.W. Fulton (1901, 1904), who along with C.G.J. Petersen, invented length-frequency analysis.
This awareness faded away, however, when fishery scientists gradually switched away from the analysis of length data and used ‘annuli’ (on otoliths, scales and other bones) to estimate growth rate and draw growth curves (Went 1972). Thus, Beverton and Holt, in their classic of 1957, did not consider seasonal growth oscillations in more than cursory manner, and particularly, saw no point in modifying the basic von Bertalanffy growth function (VBGF) to express such oscillations, although they occur in all the fishes they studied.
Following a discussion of seasonal growth by von Bertalanffy and Müller (1943), the first published version of the VBGF allowing for such oscillation was that of Ursin (1963a, 1963b). Other modifications of the VBGF were those of Pitcher and MacDonald (1973) and Daget and Ecoutin (1976). Improvements of these earlier models and various approaches for fitting them followed in quick successions (Cloern and Nichols 1978; Pauly and Gaschütz 1979; Appeldoorn 1987; Somer 1988; Soriano and Pauly 1989). The application examples presented by these authors made it quite obvious that growth models which do not explicitly consider seasonal oscillations fail to capture an essential aspect of the growth process (Pauly 1990).
This is also true for tropical fishes, since winter-summer temperature differences as small as 2° C are sufficient to induce seasonal growth oscillations which, while not detectable visually, are still statistically significant (Pauly and Ingles 1981; Longhurst and Pauly 1987).
The growth model which best accounts for seasonal growth oscillation is probably that of Somer (1988), of the form
Lt = L¥ {1 – exp – [ K (t – t0) + S(t) – S(t0)]} …1)
where
L¥ , K and t0 are defined as in the standard VBGF;
S(t) = (CK/2p ) Sin p (t – t
s); and
S(t0) = (CK/2p ) Sin p (t0 - t
s).
Equation (1) has two parameters more than the standard VBGF: C and t
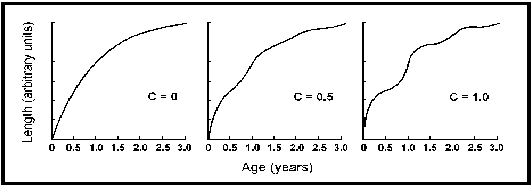
s. Of these, the former is easiest to visualize, as it expresses the amplitude of the growth oscillations. When C = 0, equation (1) reverts to the standard VBGF. When C = 0.5, the seasonal growth oscillations are such that growth is increased by 50% at the peak of the ‘growth season’, i.e., in ‘summer’, and, briefly, reduced by 50% in ‘winter’. When C = 1, growth increases by 100%, i.e., doubles during ‘summer’, and becomes zero in the depth of ‘winter’ (see Fig. 25).
The second new parameter, t
s , expresses the time between t = 0 and the start of a sinusoid growth oscillation. For visualization, it helps to define ts + 0.5 = WP, which expresses, as a fraction of the year, the period when growth is slowest. WP is often near 0.1 (i.e., mid-February) in the northern and 0.6 (mid-August) in the southern hemisphere, hence the name. [Note that it is not necessarily the alternation of high summer and low winter temperatures which causes the seasonal oscillations of growth; in freshwater fishes, e.g., of the Amazon, such oscillations are due to the alternation of flood and dry seasons. Note also that equation (1) cannot describe long periods of zero growth (and values of C > 1), a problem discussed in Pauly et al. (1992)].
As this model and its predecessors (notably the model of Pauly and Gaschütz 1979) have been fitted to numerous sets of seasonally oscillating growth data, a number of estimates of C exist, covering a wide range of fish species and habitats.
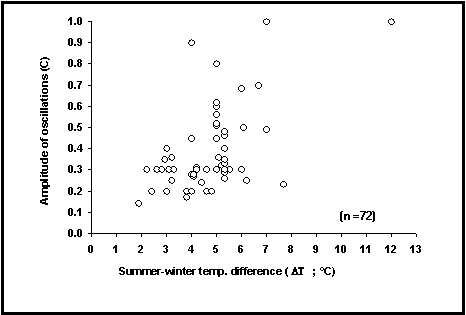
The POPGROWTH table of FishBase includes most of the estimates of C so far published for fish, along with matching estimates of the summer-winter temperature difference (D T; difference of mean monthly values, in ° C). As might be seen on Fig. 26, these C values are linearly related to D T, with C near 1 when D T is about 10° C.
Some of the physiological implications of this relationship, known since the early 1980s (see e.g., Pauly and Ingles 1981), are discussed in Longhurst and Pauly (1987).

Fig. 25. The effect of the amplitude parameter C on a von Bertalanffy growth curve with L¥
= 25 units; K = 1year-1, t0 =
0 and ts = 0.

Fig. 26. The relationship between the parameter C, expressing the amplitude of seasonal growth oscillations in
72 fish populations and the summer-winter temperature differences of their habitat (D
T; °
C).
You get to the graph corresponding to Fig. 26 from the GRAPHS menu, under the Report button of the Main Menu.
The parameters of seasonal growth (C, WP) are available in the POPGROWTH table which can be accessed on the Internet by clicking on the Growth link in the ‘More information’ section of the ‘Species Summary’ page.
Appeldoorn, R. 1987. Modifications of a seasonal growth function for use with mark-recapture data. J. Cons CIEM 43:194-198.
Bertalanffy, L. von and I. Müller. 1943. Untersuchungen über die Gesetzlichkeit des Wachstums. VIII. Die Abhängigkeit des Stoffwechsels von der Korpergrösse und der Zusammenhang von Stoffwechseltypen und Wachstumstypen. Rev. Biol. 35:48-95.
Beverton, R.J.H. and S.J. Holt. 1957. On the dynamics of exploited fish populations. Fish. Invest. Ser. II. Vol. 19, 533 p.
Cloern, J.E. and F.H. Nichols. 1978. A von Bertalanffy growth model with a seasonally varying coefficient. J. Fish. Res. Board Can. 35:1479-1482.
Daget, J. and J.M. Ecoutin. 1976. Modéles mathématiques de production applicables aux poissons tropicaux subissant un arrêt annuel prolongé de croissance. Cah. ORSTOM, sér. Hydrobiol. 10(2):59-69.
Fulton, T.W. 1901. The rate of growth of the cod, haddock, whiting and Norway pout. 19th Ann. Rep. Fish. Board Scotland. Part III:154-228.
Fulton, T.W. 1904. The rate of growth of fishes. 22nd Ann. Rep. Fish. Board Scotland. Part III:141-240.
Longhurst, A.R. and D. Pauly. 1987. Ecology of tropical oceans. Academic Press, San Diego, California. 407 p.
Pauly, D. 1990. Length-converted catch curves and the seasonal growth of fishes. Fishbyte 8(3):33-38.
Pauly, D. and G. Gaschütz. 1979. A simple method for fitting oscillating length growth data, with a program for pocket calculators. I.C.E.S. CM 1979/6:24. Demersal Fish Cttee, 26 p.
Pauly, D. and J. Ingles. 1981. Aspects of the growth and natural mortality of exploited coral reef fishes, p. 89-98. In E.D. Gomez, C.E. Birkeland, R.W. Buddemeyer, R.E. Johannes, J.A. Marsh and R.T. Tsuda (eds.) The reef and man. Proceedings of the Fourth International Coral Reef Symposium. Vol. 1, Marine Science Center, University of the Philippines, Quezon City.
Pauly, D., M. Soriano-Bartz, J. Moreau and A. Jarre. 1992. A new model accounting for seasonal cessation of growth in fishes. Aust. J. Mar. Freshwat. Res. 43:1151-1156.
Pitcher, T.J. and P.D.M. MacDonald. 1973. Two models for seasonal growth in fishes. J. Appl. Ecol. 10:599-606.
Somer, I.F. 1988. On a seasonally oscillating growth function. Fishbyte 6(1):8-11.
Soriano, M. and D. Pauly. 1989. A method for estimating the parameters of a seasonally oscillating growth curve from growth increments data. Fishbyte 7(1):18-21.
Ursin, E. 1963a. On the incorporation of temperature in the von Bertalanffy growth equation. Medd. Danm. Fisk. Havunders. N.S. 4(1):1-16.
Ursin, E. 1963b. On the seasonal variation of growth rate and growth parameters in Norway pout (Gadus esmarki) in Skagerrak. Medd. Danm. Fisk. Havunders. N.S. 4(2):17-29.
Went, A.E.J. 1972. Seventy years agrowing: a history of the International Council for the Exploration of the Sea, 1902-1972. Rapp. P.-V. Réun. CIEM 165. 252 p.
Daniel Pauly